

By Tanguy Duthion
·
June 27, 2026
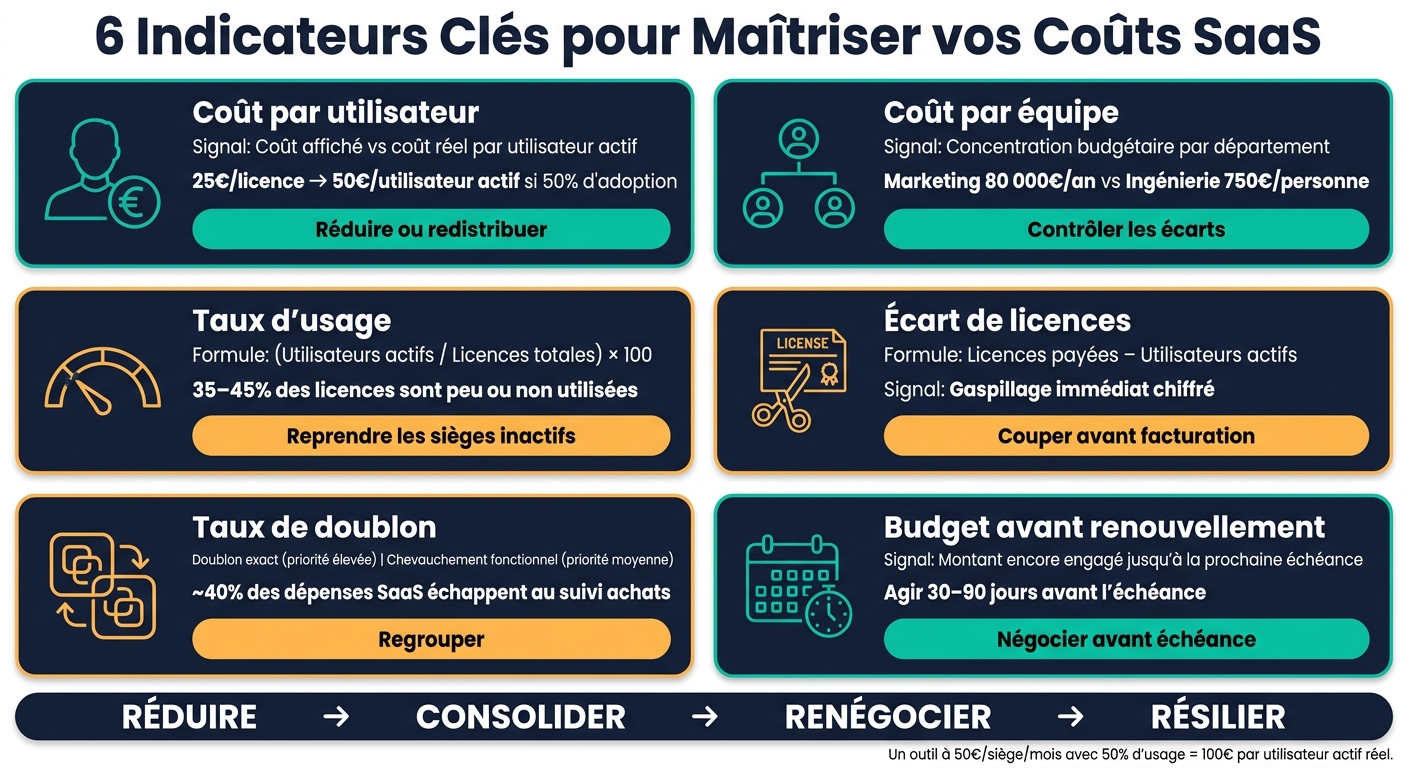
I can sum up this article in one simple idea: total SaaS spend is not enough. To know what to cut, consolidate, and renegotiate, I track six metrics: cost per user, cost per team, usage rate, the gap between paid and active licenses, duplicate rate, and budget remaining before renewal.
In practice, these metrics help identify inactive licenses, tools that overlap, and contracts to address before renewal. For example, a tool costing €25,000 a year for 1,000 licenses costs €25 per license, but if only 500 people use it, the cost rises to €50 per active user.
Here is what I take away:
A few figures stand out:
| Metric | What it shows me | Decision to make |
|---|---|---|
| Cost per user | Whether I am paying too much for too little usage | Reduce or redistribute |
| Cost per team | Where spending is concentrated | Check differences between departments |
| Usage rate | The share of active licenses | Reclaim inactive seats |
| License gap | Immediate waste | Cut before billing |
| Duplicate rate | Redundant tools | Consolidate |
| Budget before renewal | Money that is still committed | Negotiate before the deadline |
In short, I read these six figures together to rank my actions: reduce, consolidate, renegotiate, or terminate.
These two metrics turn a global SaaS budget into something actionable. One shows what is happening at the individual level. The other helps reveal which departments concentrate the spend.
Cost per user can be read in two ways: per paid license and per active user. Cost per paid license means dividing total spend by the number of licenses purchased. Cost per active user uses the same spend, but divides it by the number of users who use the product during a given period.
Take a simple example. A company pays €25,000 a year for 1,000 licenses, or €25 per license. But if only 500 users are active, the cost rises to €50 per active user. This gap is not trivial: it often points to overprovisioning or low adoption [2][3][4].
When cost per active user rises, the message is often quite clear. Either the tool is underused, licenses are poorly allocated, or teams have not adopted it as part of their routine. Market studies also estimate that 35 to 45% of purchased licenses remain unused or underused. As a result, cost per active user can quickly exceed — sometimes by a wide margin — the advertised price [5].
A tool costing €50.00 per seat per month at 50% usage actually costs €100.00 per active user per month, twice the apparent cost [3].
Once you have identified this signal, go one step further. This is where cost per team becomes useful: it shows where money goes across the organization.
Cost per team groups a department's SaaS spending and then relates it to the department's headcount. For cross-functional tools, it is better to allocate spend according to actual usage or the number of active licenses. Otherwise, teams are compared on unreliable foundations.
Here is the simplest way to read the two metrics.
| Metric | Objective | Formula | Data required | A high value indicates |
|---|---|---|---|---|
| Cost per user | Measure individual ROI and adoption | Total tool cost / active users | Invoices + SSO/usage logs | Low adoption or overprovisioning |
| Cost per team | Identify budget concentration | Total allocated SaaS spend / department headcount | Financial data + HR organization chart | Tool stacking or a broader tool scope |
This metric is particularly useful during portfolio reviews. A Marketing team spending €80,000 a year on several campaign tools, with few logins, deserves a closer look. By contrast, an Engineering team spending €750 per person on heavily used tools may have a perfectly valid reason for that level of spend.
After allocating spend by user and team, look at actual usage. This is where you see which budget is going nowhere. Spend alone does not tell you whether licenses are being used.
The usage rate measures the share of purchased licenses being used: (active users / total licenses) × 100.
Be sure to distinguish detected accounts from active accounts: only active accounts belong in the calculation [6][7].
A usage rate of 60% means one simple thing: 40% of licenses remain inactive. This is not just a number to note in a spreadsheet. It is a signal to act on immediately.
The first metric measures adoption. The second puts a waste amount next to it.
The gap between paid and active licenses is calculated by subtracting the number of active users from the total number of paid licenses. The result shows how many unused licenses the company is funding without a return.
It is a useful reference for quickly finding licenses to reclaim before renewal.
| Metric | Formula | What it reveals |
|---|---|---|
| Usage rate | (Active users / Total licenses) × 100 | Share of purchased capacity that is actually used |
| License gap | Paid licenses − Active users | Number of unused licenses to recover |
By cross-referencing these two metrics, you can identify inactive licenses before renewal. Then check duplicates and contracts approaching their renewal date as part of your SaaS Management.
After usage and inactive licenses, two other signals help complete the diagnosis: duplicates and the share of the budget still locked into contracts.
The duplicate rate shows the share of applications that meet the same need, wholly or partly. It is important to distinguish two situations.
An exact duplicate is, for example, two active contracts for the same software in two departments. The company is paying twice for the same service. Functional overlap is different: two project-management tools used in parallel. The products are not identical, but the use case is.
Both harm SaaS spend optimization. The second case, however, is more likely to go unnoticed. It also takes longer to resolve because you need to choose a standard tool, organize a migration, and align teams. Ultimately, these situations erode the budget, fragment data, and make governance more complex.
| Type | Concrete example | Impact | Priority |
|---|---|---|---|
| Exact duplicate | Two subscriptions to the same tool in two teams | Double payment for the same service | High: immediate consolidation possible |
| Functional overlap | Two messaging or project-management tools used in parallel | Higher costs, fragmented data, complex governance | Medium: plan the migration before the next renewal |
Once these duplicates have been identified, look at another very practical point: how much money remains committed before you can act.
Budget remaining before renewal is the amount still committed until the next deadline. Put simply, it shows how much remains to be paid and until what date the budget is locked.
This is what helps prioritize actions. A contract that expires in less than 90 days and has a high rate of inactive licenses should rise to the top of the list. There is little time left to negotiate. If the date passes, the contract often renews automatically for another 12 months. Conversely, a contract expiring in more than six months leaves enough room for a deeper usage audit before making a decision.
As a rule, 40% of SaaS spending escapes procurement control [1]. When part of the SaaS portfolio is not monitored, some renewals go through unnoticed. The result: the budget remains committed for another year to tools that are underused or duplicated.
Once the signals have been identified, read them together to rank actions by priority. The idea is simple: cross-reference the metrics to know what to cut, consolidate, and renegotiate.
| Metric combination | Signal | Recommended action |
|---|---|---|
| High cost per user + low usage rate | Underused licenses, degraded ROI | Move to a lower tier or reallocate licenses |
| Large gap between paid and active licenses | Immediate financial leakage | Suspend or remove inactive seats before the next billing cycle |
| High duplicate rate | Fragmented tools, heavier governance | Consolidate around one tool per category |
| Large budget still committed before renewal | Budget tied up | Prioritize negotiation 30 to 90 days before the renewal date |
Taken separately, these figures provide an indication. Read together, they lead to concrete decisions. A simple example: a high cost per user in a Sales team does not tell the same story as the same cost in a Support team. The business context, usage patterns, and importance of the tool in day-to-day work matter as much as the figure itself [7][1].
Avanoo centralizes these metrics, identifies Shadow IT, including undeclared AI tools, and sends alerts before renewals.
The goal is not simply to reduce SaaS spending. It is mainly to regain control over it. To get there, you need a shared set of metrics, regular portfolio reviews, and a systematic link between usage data and contract data.
Timing often makes all the difference. Acting before renewal dates, rather than after them, is what turns a simple audit into real savings. Strong governance also makes budget decisions more predictable — and easier to defend to leadership.
::: faq
Divide the total subscription cost by the number of active users during the chosen period.
This is not the total number of licenses purchased, but actual usage. To measure it, use login data and usage frequency over 30, 60, or 90 days, for example.
This metric shows what the subscription costs per user who actually uses it. It is simple, but highly informative. It also helps identify licenses that are barely used or have been left idle. :::
::: faq
As a general rule, a usage rate is considered low below 50%. In most cases, this points to underused licenses or organizational friction.
Conversely, a rate between 70% and 80% is often considered a good balance. It is high enough to show that the tool is being used without suggesting that teams are running out of capacity.
Before terminating anything, proceed carefully. Some tools support occasional needs and therefore naturally show a lower usage rate. :::
::: faq
Act 30 to 90 days before the renewal date. In most cases, contracts provide for automatic renewal, with a termination notice period that falls within this window.
Preparing the case four to six weeks in advance helps avoid an unwanted renewal. It also leaves time to renegotiate based on actual usage or remove tools that are no longer needed. :::

Co-fondateur & CEO
Tanguy Duthion is co-founder and CEO of Avanoo. Previously at Google and Asana, he founded Avanoo to help organizations regain control over their SaaS and AI usage.
See how Avanoo can map your SaaS and AI landscape, reduce risk, and optimize costs. A reliable platform with dedicated human support.
